What did I learn from doing this assignment?
I learned how to do a spread sheet and graph data from a survey report.
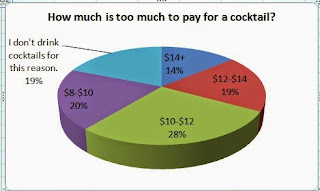
According to the Esquire Survey of Drinking, "More than 5,000 of you recently completed our survey on where, when, how much, and with whom you drink." The graphs above show some of the results.
- The first step to making the graph was done in MS Excel program by converting the survey data and percentages to a chart for each question.
- I have 3 charts from different questions asked on the survey.


No comments:
Post a Comment